#Meta_Data: The Scary Side of Standardization
Who You Gonna Call? Standard Data!
Unveiling the Data Scaries
We’ve all felt the Sunday Scaries, right?
Well, data-loving cohorts, as it turns out our laypeople collaborators (particularly those in marketing and communications) typically freak out when a smorgasbord of numbers, spreadsheets, and pivot tables fill their inboxes. Invariably, it is up to us (the left-brained populous) to dig them out of their predicament and ultimately save the day — with the rational, data-driven insights they need, packaged and delivered in a format that is easily digestible for the less, erhm… data intelligent.
That said, it’s important to note that said cohorts are working for us, not against us. But they need translation. See, just as they can write themselves out of a straightjacket, a v-lookup is as terrifying to them as the blue screen of death is to us.
So, where do we go from here? Collaboration. Yes, collaboration. And a general understanding of the other group’s pain-points, which thankfully, we’re here to massage for you. Read on, friends.
Oversharing is Caring
Data professionals are privy to a vast number of insights. So often, we take for granted what we *think* our collaborators should know. Oversharing is caring, so when you take the meeting with the comms folks, be sure to clearly articulate even the simplest of concepts and ask clarifying questions to be sure the data lands appropriately. We all know it: data lost in translation is one of the scariest of data scaries…
Hypothesize their Hypotheses
Non-data people often generalize their own hypotheses and as such typically have a difficult time disputing their own conjectures, even if the data is overwhelmingly contrarian. Thus, as the smartest folks in the room (but, for real…) it is our duty to predetermine the biases and hypotheses they will be bringing to the conversation and be prepared to address them accordingly with clear, concise factual evidence derived from data. In essence, “do your homework” is the adage to latch on to here.
The Devil is in the Details
Triple-check all the numbers, especially before a meeting-of-the-minds. We have a hard enough profession in deducing and articulating massively intricate datasets into a single, digestible report — the last thing we need is a non-number-cruncher grading our papers. In order to gain trust from “the other side”, we need to be sure we’re locked and loaded - the unfortunate reality of the less-glamorous, yet arguably more important side of business.
Tools are your Friends (and so are we)
Tools make all the difference and some are immensely more functional than others. Take Standard Data, for example. Standard Data helps organizations of all sizes Collect, Manage, and Analyze data in over 60 countries across the globe. And, with real humans backing you in your data management journey, what more could you ask for in a comprehensive toolkit? We’re here to help you do more with data, regardless of the obstacles in your path. Let’s talk.
We’ve compiled the stories below for your perusal, intelligence-building, and overall enjoyment.
Ghost Town, No More
Encouraged by the latest data, CDC recommends that folks swap out the N95s for one of these bad boys and hit the streets for tricks and treats this year.
Do You Own a Green Tracksuit?
If so, you’re on track to match everyone else this Halloween. Search data shows that ‘Squid Games’ costumes are sure to be the #1 look of 2021.
Retailers Put a Spell On You
NRF’s Halloween Spending Survey indicates that consumers are running like bats out of hell to stock up on candy, costumes, and decorations after a dead 2020 season.
An Interactive Candy Land
Candystore.com gathered 14 years of bulk candy sales data in order to map out America’s favorite Halloween candy, state by state. Hey, someone’s gotta do the devil’s work.
A Graveyard Smash
Spotify’s top spooky tracks will send shivers down your spine — turn it up and have a Happy Halloween!
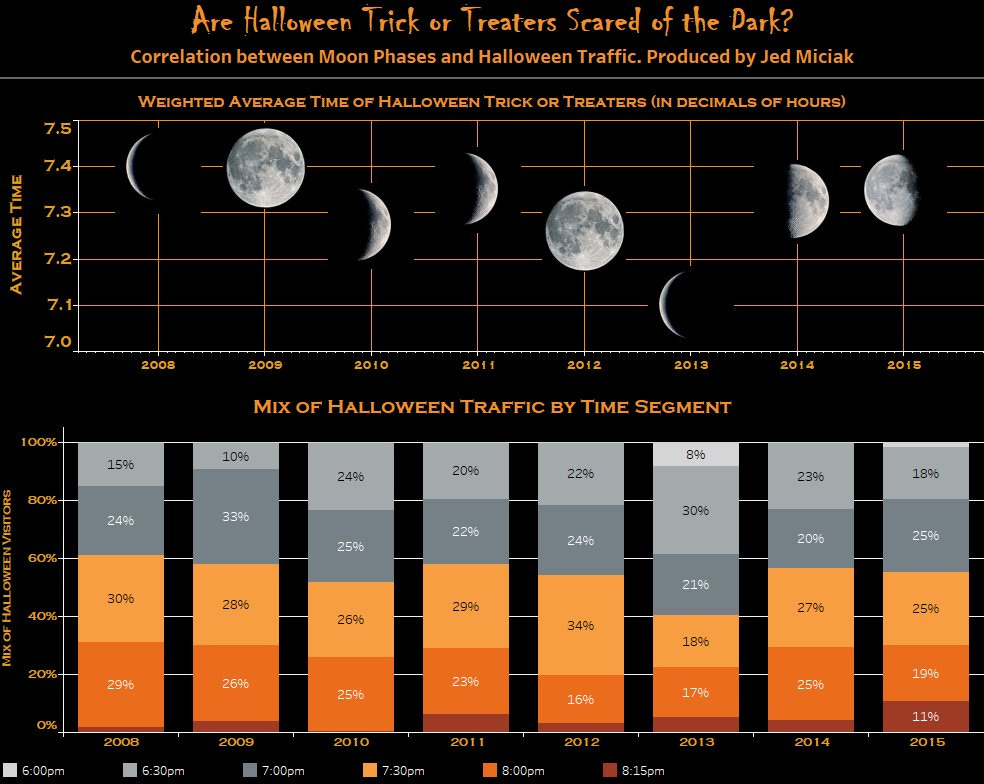
Are you afraid of the dark? This witchin’ #HalloweenViz creation is here to find out…
What’s scarier than a sh*tload of unstructured data?
Literally NOTHING!
Facts. #datajokes


