
#Meta_Data: The Drought Mapping Project
Greta Thunberg is tired of the “blah, blah, blah…” And so are we.


The world is changing — and, according to a lot of real scientists, not for the better. Global temperatures are expected to *rise* 16% by 2030 (when many countries have pledged to reduce emissions by half of present day levels) according to UN Climate Change’s NDC Synthesis Report. Hell, even earlier this week, NPR reported that the Feds just declared 20+ rare species officially extinct.
Addressing the Youth4Climate audience, Greta Thunberg recently lambasted the world’s “so-called leaders” for wasting 30+ years on rhetoric and empty promises, a “betrayal toward all present and future generations”. Nicely put, Greta.
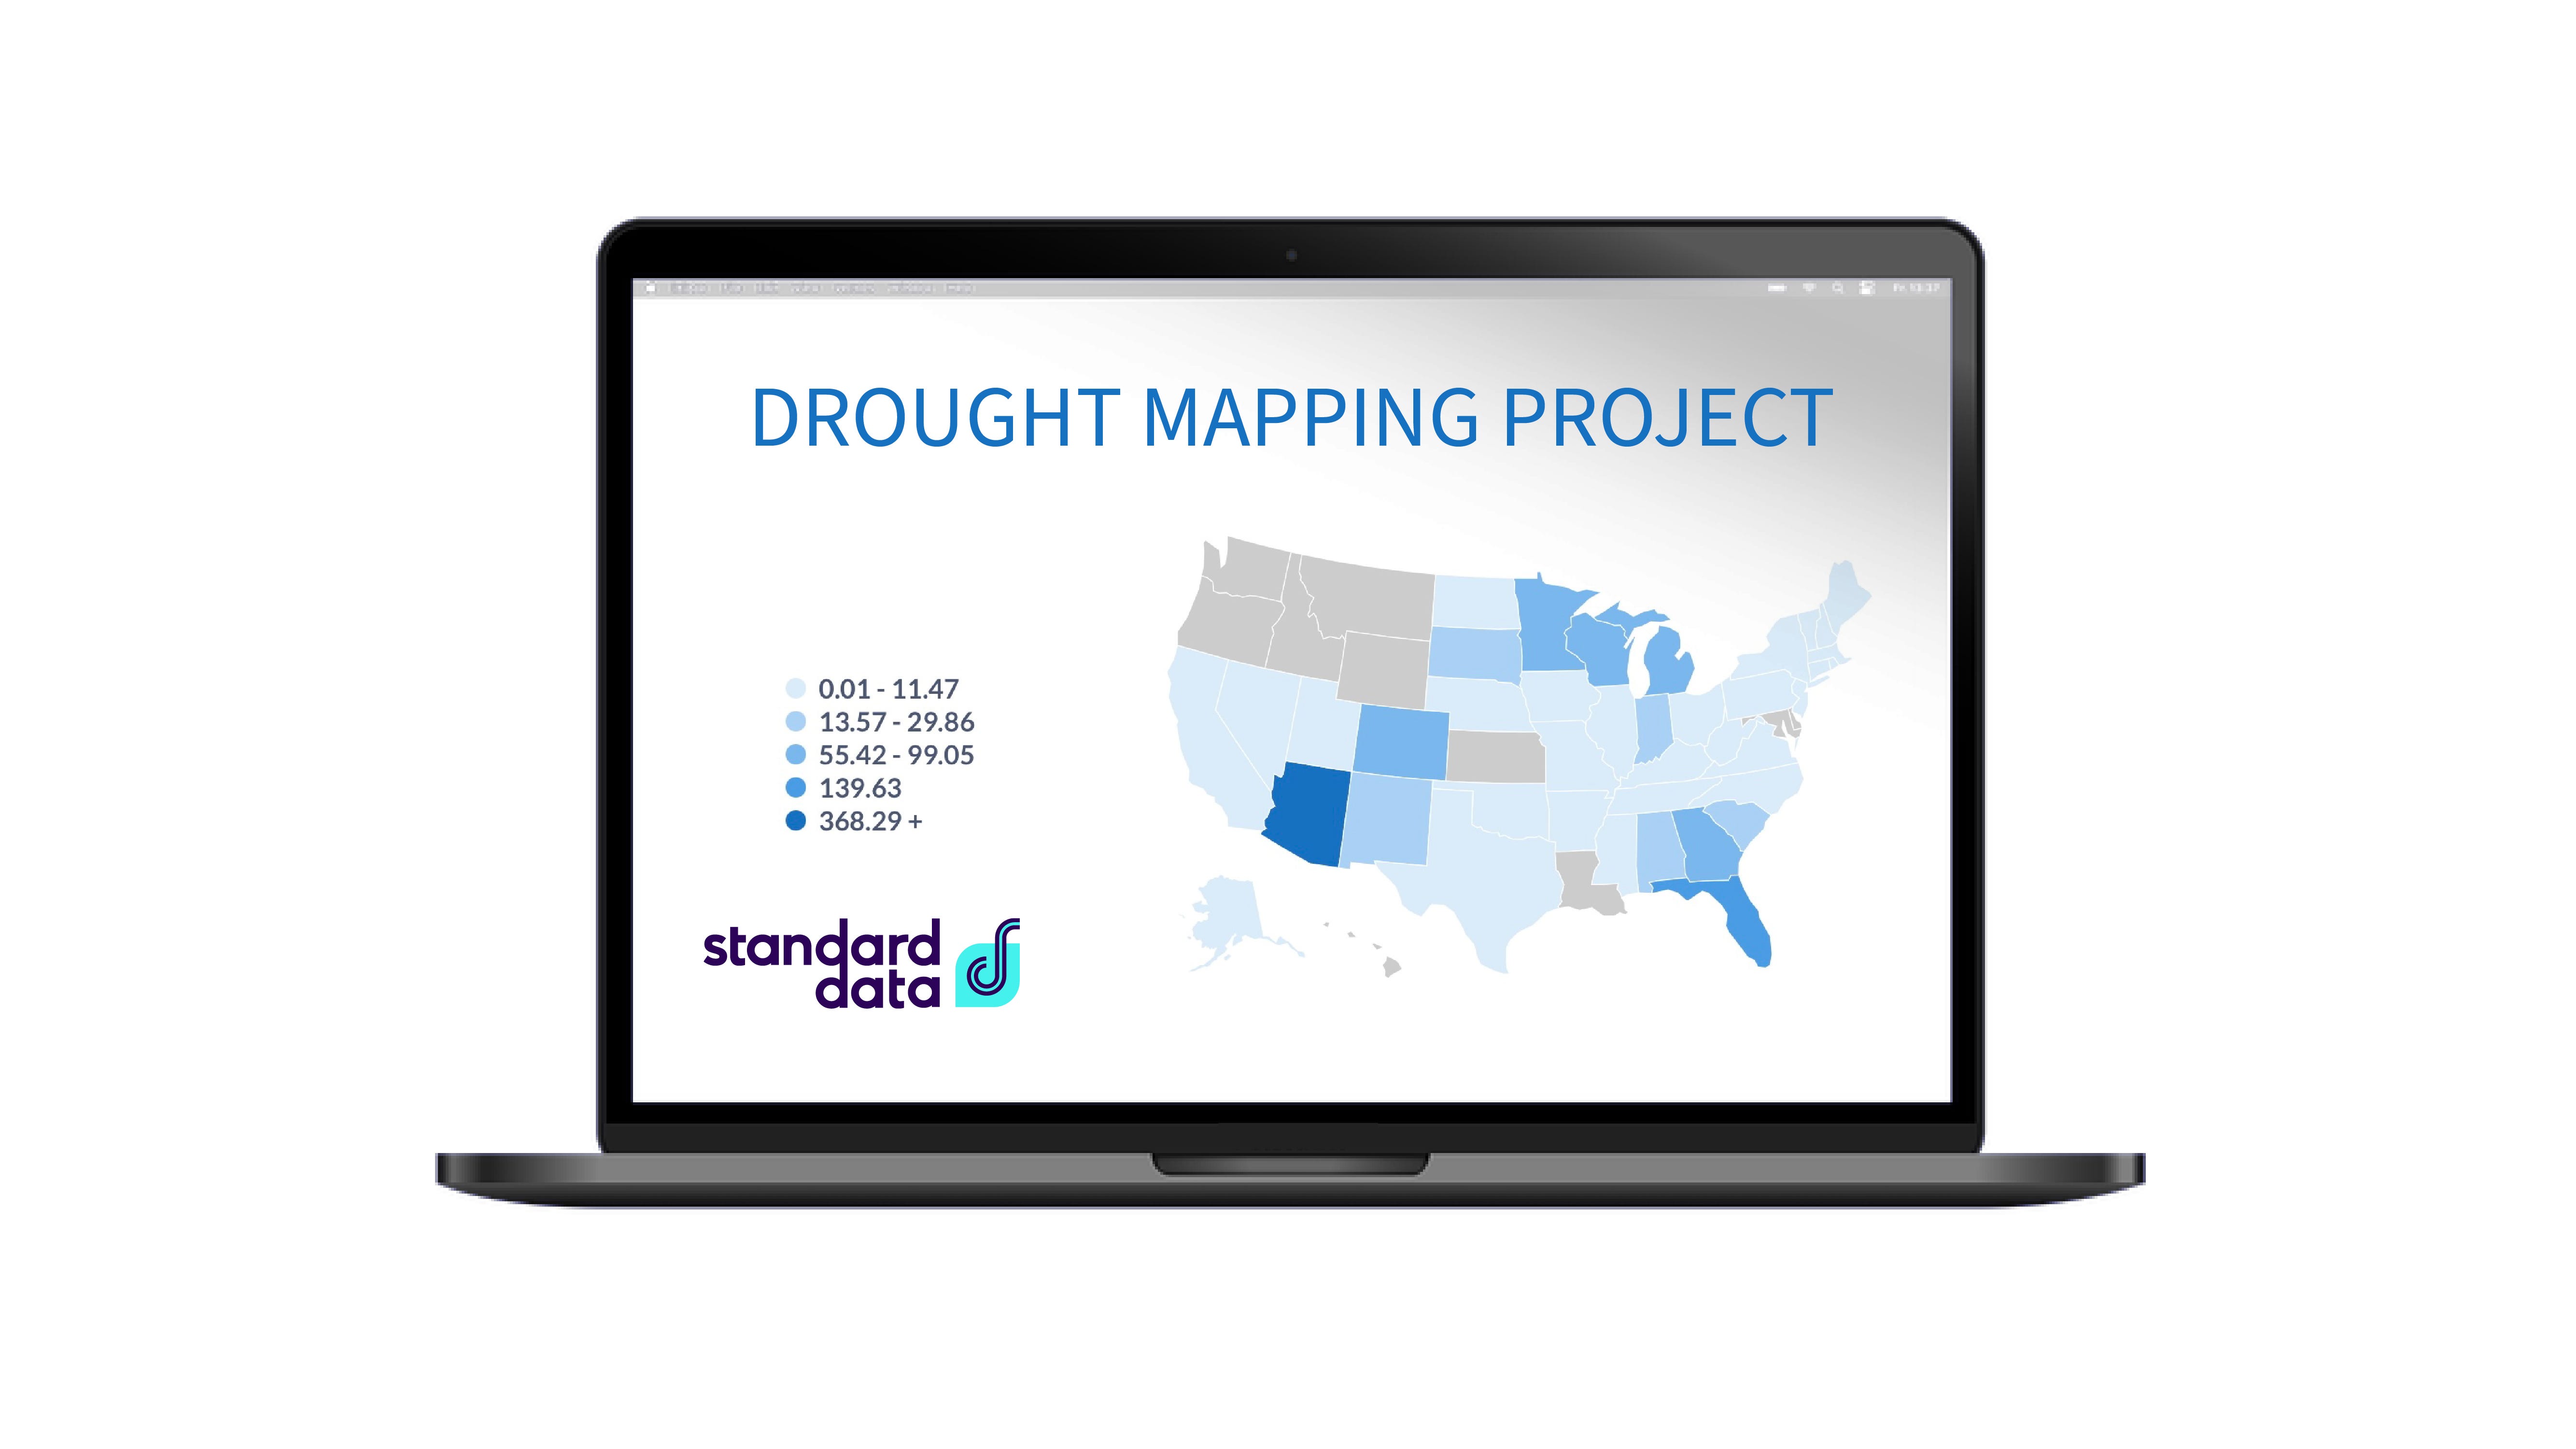
We’re not climatologists. We’re really not even official activists. We’re data managers — so, in an effort to help articulate what’s happening in our neck of the woods, we’re kicking off a project aptly titled Drought Mapping Project to help visualize US data surrounding precipitation levels (or lack thereof) as water availability (read: scarcity) becomes an increasing concern.
The Standard Co team is scattered all throughout the world, more so when factoring our clients and friends, so this data truly impacts each of us — and our latest side-hustle means all the more to our little data family as we continuously aim to save more lives (and make better decisions, faster) with data.
Stay tuned, Drought Mapping Project will be available for perusal soon. Our team of real human data management experts are pulling together something so truly impressive, even Greta might crack a smile in our direction.

We’ve compiled the stories below for your perusal, intelligence-building, and overall enjoyment.
The Justice Navigator
The Center for Policing Equity teamed up with Google.org to build an interactive web app that collects, analyzes, and visualizes data surrounding police use of force, traffic stops, etc.
Workin’ for the Weekend
Johns Hopkins University compiled this state-by-state COVID-19 reporting guide. Guess what, tons of states are *still* failing to report basic information.
150 Years in the Making
Wait for it. This #dataviz takes viewers through global temperature anomalies from 1851 to present. The end is very scary, y’all.
We’re Loving Viz for Social Good
This group is doing the data lords’ work, pro-bono. By tapping volunteers, Viz for Social Good helps global nonprofits visualize progress, build impact reports, and measure success.
Slippery Slopes
Nationwide droughts are impacting snowpack in the Western US, promising treachery beyond just ski vacations (pro tip: buy travel insurance).

We like your thought-process, Justin.


Ever wish you could click a button to activate a powerful, visually stunning dashboard in just minutes, not weeks? Now you can. Introducing Auto-Dashboard, Standard Data’s latest Standard feature. Enjoy, data-lovers.

Jenna is in serious need of Standard Data’s Auto-Dashboard feature… just sayin’! #datajokes
